Economic Indicators
Unemployment Rates
According to the BLS current population survey (CPS), the unemployment rate for Wisconsin rose 0.1 percentage points in November 2023 to 3.3%. The state unemployment rate was 0.4 percentage points lower than the national rate for the month. The unemployment rate in Wisconsin peaked in April 2020 at 14.1% and is now 10.8 percentage points lower. From a post peak low of 2.4% in April 2023, the unemployment rate has now grown by 0.9 percentage points. You can also see Wisconsin unemployment compared to other states.
https://www.deptofnumbers.com/unemployment/wisconsin/ (state link)
https://jobcenterofwisconsin.com/wisconomy/wits_info/images/LAUS/uRatesCo.pdf (county link)
Yield Spread
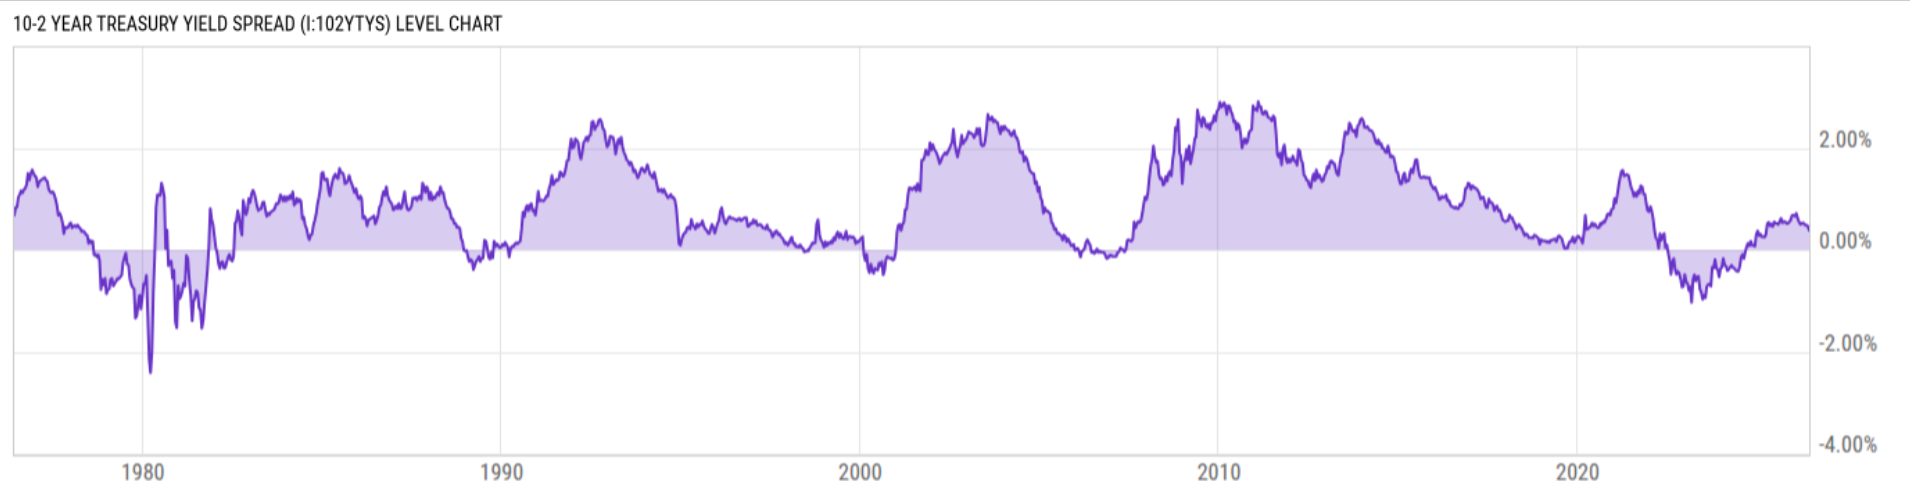
10-2 Year Treasury Yield Spread is at 0.38%, compared to 0.40% the previous market day and 0.49% last year. This is lower than the long term average of 0.85%.
The 10-2 Treasury Yield Spread is the difference between the 10 year treasury rate and the 2 year treasury rate. A 10-2 treasury spread that approaches 0 signifies a "flattening" yield curve. A negative 10-2 yield spread has historically been viewed as a precursor to a recessionary period. A negative 10-2 spread has predicted every recession from 1955 to 2018, but has occurred 6-24 months before the recession occurring, and is thus seen as a far-leading indicator. The 10-2 spread reached a high of 2.91% in 2011, and went as low as -2.41% in 1980.
Source: https://ycharts.com/indicators/10_2_year_treasury_yield_spread
U.S. Durable Goods
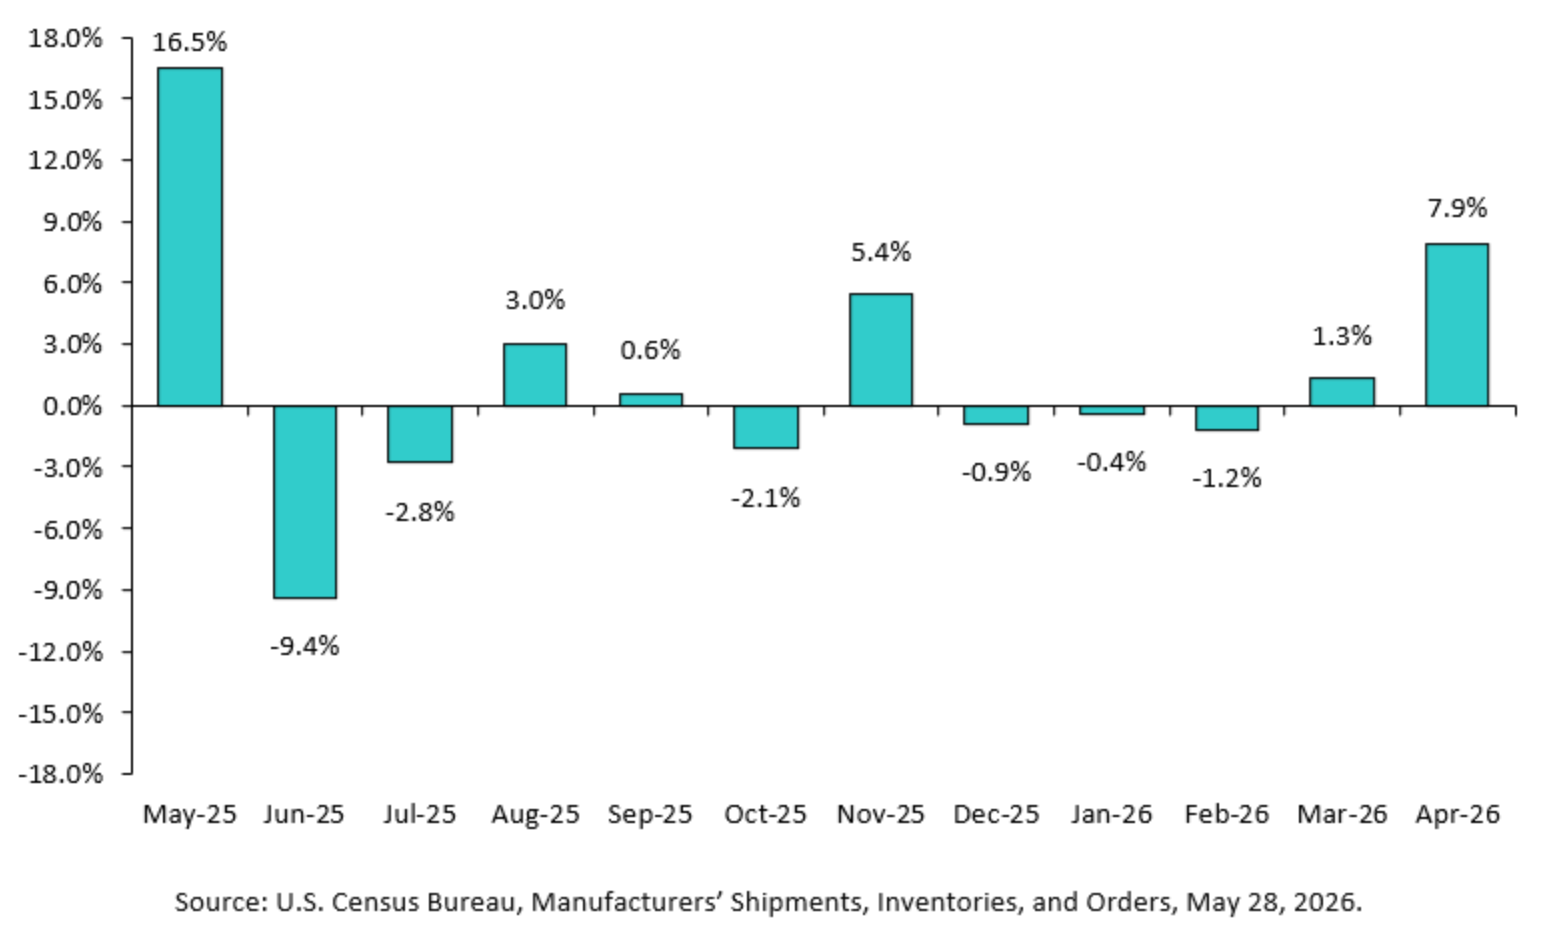
New orders for manufactured durable goods in April, up two consecutive months, increased $25.5 billion or 7.9 percent to $346.0 billion, the U.S. Census Bureau announced today. This followed a 1.3 percent March increase. Excluding transportation, new orders increased 1.1 percent. Excluding defense, new orders increased 8.1 percent. Transportation equipment, also up two consecutive months, led the increase, $23.1 billion or 21.5 percent to $130.9 billion.
Source: U.S. Census Bureau
https://tradingeconomics.com/united-states/durable-goods-orders
Crude Spot Oil Prices
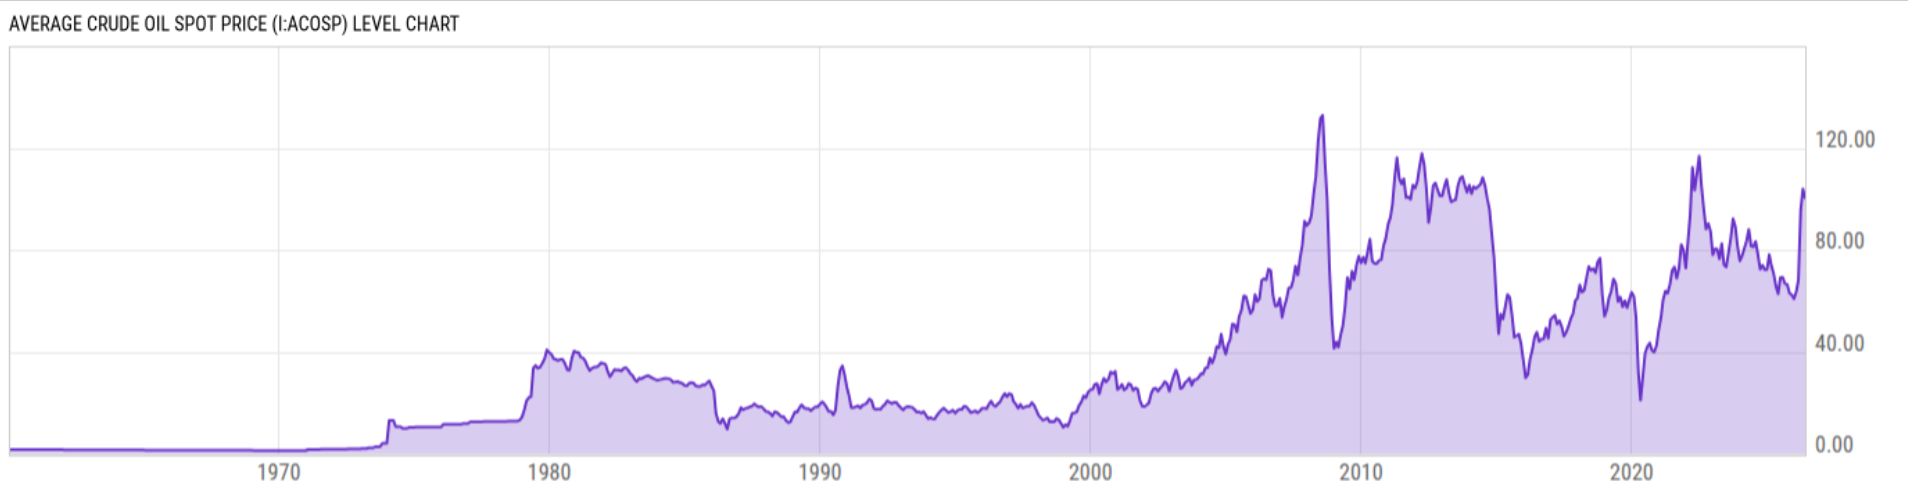
Average Crude Oil Spot Price is at a current level of 100.43, down from 103.91 last month and up from 65.90 one year ago. This is a change of -3.35% from last month and 52.39% from one year ago. The Average Crude Oil Spot Price calculates an equally weighted price of the WTI Crude Oil Price, Brent Crude Oil Price, and Dubai Crude Oil Price. This metric gives a nice overview of the broad crude oil market, rather than looking at one type of crude oil price alone. One of the most notable times for the Average Crude Oil Spot Price was in 2008. Prices for the Average Crude reached as high as $114/barrel because of large cuts in production. However, because of the financial crisis and an abrupt loss of demand for oil globally, the price of Average Crude fell as much at 70% off highs in January of 2009.
Source:
https://ycharts.com/indicators/average_crude_oil_spot_price